Foundations of R: Why R for Data Science?
The Power and Purpose Behind the Code
Learning Objectives
By the end of this module, you will be able to:
Critique the limitations of spreadsheet software (like Excel) in the context of professional scientific research and reproducibility.
Define the fundamental nature of R as an open-source, community-driven statistical language.
Identify key R applications in bioinformatics, data visualization, and automated reporting.
Evaluate the strengths of R vs. Python to make informed decisions for your specific research or career path.
Navigate a curated list of self-taught resources to continue your R journey beyond this workshop.
1. Why Not Excel? / Why Not GraphPad Prism?
Excel is a fantastic tool for initial data entry and simple calculations. GraphPad Prism is also widely used for statistical analysis and data visualization.
However, for professional scientific research, it has some limitations that can compromise your results.
The Limitations of Spreadsheets and Prism
Inflexible with Large Data: Large datasets (like genomic data) often cause Excel to lag or crash. Searching a 100MB spreadsheet can take minutes in Excel.
- In R, the same search takes milliseconds. R is designed to handle millions of rows efficiently and uses optimized data compression to keep your workflow fast.
Automatic “Auto-Correct” Errors: Excel is famous for “helpfully” converting gene names like MARCH1 into dates (e.g., 01-March-2025). This has historically corrupted thousands of published papers.
In R, your data is treated as pure text by default. R won’t change your data unless you explicitly tell it to.
Note: The only common “auto-change” in R is the word
NA, which R reserves for “Not Available” (missing data)—we will discuss this later.
Poor Reproducibility: In Excel, if you accidentally delete a cell or change a value, there is no “audit trail.” You might never notice the mistake.
- In R, every change is documented in your code. You can add comments to explain why you made a change, allowing you (and your collaborators) to follow your logic months later.
Version Incompatibility: We have all experienced an Excel file that looks perfect on a Mac but appears broken or “skewed” when opened on Windows or in different software like Numbers or WPS.
- R is a pure programming language, meaning your code will run exactly the same way regardless of the operating system.
The “Copy-Paste” Risk: Many students store data in Excel but copy-paste it into software like GraphPad Prism or SPSS for analysis. This manual step is a major source of human error. It’s easy to lose track of which version of the data you copied.
- In R, you import your data directly via code. This creates a clear, permanent link between your raw data and your final results.
Cost: One major limitation of GraphPad Prism is its price: approximately $500+ per year for two seats, rising to $1,000+ per year for larger labs.
- R is completely free and open-source.
Excel remains the most user-friendly interface for manual data entry and “beautifying” simple tables for quick viewing.
I personally recommend a hybrid workflow:
Use Excel (specifically saving as .csv files rather than .xlsx, just my personal preference) for initial data storage.
Use R for all subsequent data cleaning, statistical analysis, and publication-quality visualization.
2. What is R?
R is more than just a tool; it is a Statistical Programming Language designed by scientists, for scientists. It is an integrated suite for data manipulation, calculation, and graphical display.
The “Free” in Free Software
In the world of coding, we often say R is “Free as in Speech, not just free as in beer.” This means it isn’t just about the cost ($0); it is about the freedom to use and share it.
This philosophy gives you four fundamental freedoms:
Unlimited Use: You can run the program for any purpose (academic, commercial, or personal) without expensive licenses.
Full Transparency: You can study how every single calculation is performed. There is no “black box” logic hidden from the scientist.
Collaborative Sharing: You can freely share your scripts and tools with colleagues anywhere in the world.
Continuous Improvement: Anyone can fix a bug or add a new feature, which is why R has such a massive library of scientific packages.
Key R Facts
Interpreted: You type code, and R runs it immediately—no complex “compiling” needed.
If you make a mistake, you can correct it in your next sentence. You type a line of code in the console, hit Enter, and R gives you the answer immediately.
C++/JAVA (Compiled) is like a Book Publisher. Imagine you are writing a novel in English that needs to be translated into French. You have to write the entire book first. You send the whole manuscript to a publisher (the “Compiler”). They translate the whole thing at once into a new, separate book. You can only “read” the results once the entire translation process is finished. If there is a typo on page 1, you might not find out until the whole book is printed. This is Compiling: It makes the final program run very fast, but it makes the writing process much slower for the person doing it.
Object-Oriented: Everything in R (data, plots, models) is an “object” that you can save and reuse.
- Imagine these objects as labeled boxes on your desk. Each “box” (object) has its own name, a specific type of content (its class), and a specific size. You can save these boxes individually or pack them all up together to use later.
Case Sensitive:
my_dataandMy_Dataare seen as two different things.- Tips: Some R users prefer using all lowercase and underscores (e.g.,
blood_pressure) to avoid simple typing errors.
- Tips: Some R users prefer using all lowercase and underscores (e.g.,
1-Based Indexing: Unlike Python (which starts at 0), R starts counting at 1. This is much more intuitive for most researchers!
Just like in Excel, your rows start at 1, 2, 3… and your columns start at A, B, C (1, 2, 3…).
In contrast, languages like Python start counting at 0, which can be confusing if you aren’t a software engineer!
No Spaces in Variable Names: R cannot “read” a space inside a name because it thinks the space means the command has ended.
The Rule: If you try to name a dataset
Patient Data, R will look for an object calledPatientand then get confused by the wordData.The Solution: Most researchers use underscores (
patient_data) or CamelCase (PatientData) to connect words.
Allows User-Defined Functions: Beyond the built-in tools, R allows you to build your own “custom machines” to perform repetitive tasks.
- How it works: If you find yourself doing the same three steps to clean your data every single morning, you can write a Function that bundles those steps into one single command. It’s like creating your own custom button in a software program that does exactly what you need.
Works with Environments: Think of an “Environment” as your Active Workspace or your digital desk.
The Concept: When you import a file or create a variable, it lives in your “Global Environment.” In RStudio, you can actually see this list in the top-right pane.
Analogy: If your “Objects” are the labeled boxes, the “Environment” is the room where those boxes are stored. R can handle multiple “rooms” at once, which helps keep your variables from getting mixed up when you’re running complex analyses or using different packages.
3. What Can R Do?
R is a “Swiss Army Knife” for researchers.
It excels at:
Data Cleaning: Tidying messy “real-world” data into a usable format.
Big Data Handling: Have you ever tried to open a BioBank dataset with thousands of patients, hundreds of clinical variables, and tens of thousands of gene expression data points?
Speed: While these 100MB+ (or even multi-GB) files can crash Excel, R is designed to process them efficiently. What takes minutes of “loading” in a spreadsheet takes only seconds in R.
Statistics & Machine Learning: From simple T-tests to complex predictive modeling, R provides a rigorous environment for:
Classical statistical testing.
- Perform the standard t-tests, ANOVA, and Chi-square tests you need to show your PI those all-important p-values and significant differences.
Linear and non-linear modeling.
Machine learning algorithms for predicting disease outcomes or drug responses.
Bayesian & Advanced Statistics: R is the “home” of modern statistics. If you want to use Bayesian models or other “fancy” statistical methods to handle uncertainty in your research, R has the most robust tools available.
Bioinformatics: Thousands of specialized tools (via Bioconductor) for DNA/RNA/Protein analysis.
Genomics: DNA and RNA sequencing analysis (e.g.,
DESeq2).Proteomics: Analyzing protein expression and interaction.
Single-Cell Analysis: Processing complex cellular data (e.g.,
Seurat).
Visualization: Creating publication-quality plots that are far more beautiful than Excel’s defaults.
One of R’s greatest strengths is
ggplot2. You can create figures that are not only “GraphPad Prism level” but often far superior in terms of customization and complexity.Repeatability: Once you design a beautiful plot, you can apply that same style to 100 different datasets with one click.
Professionalism: Most high-impact journals (Nature, Science, Cell) feature plots created directly in R.
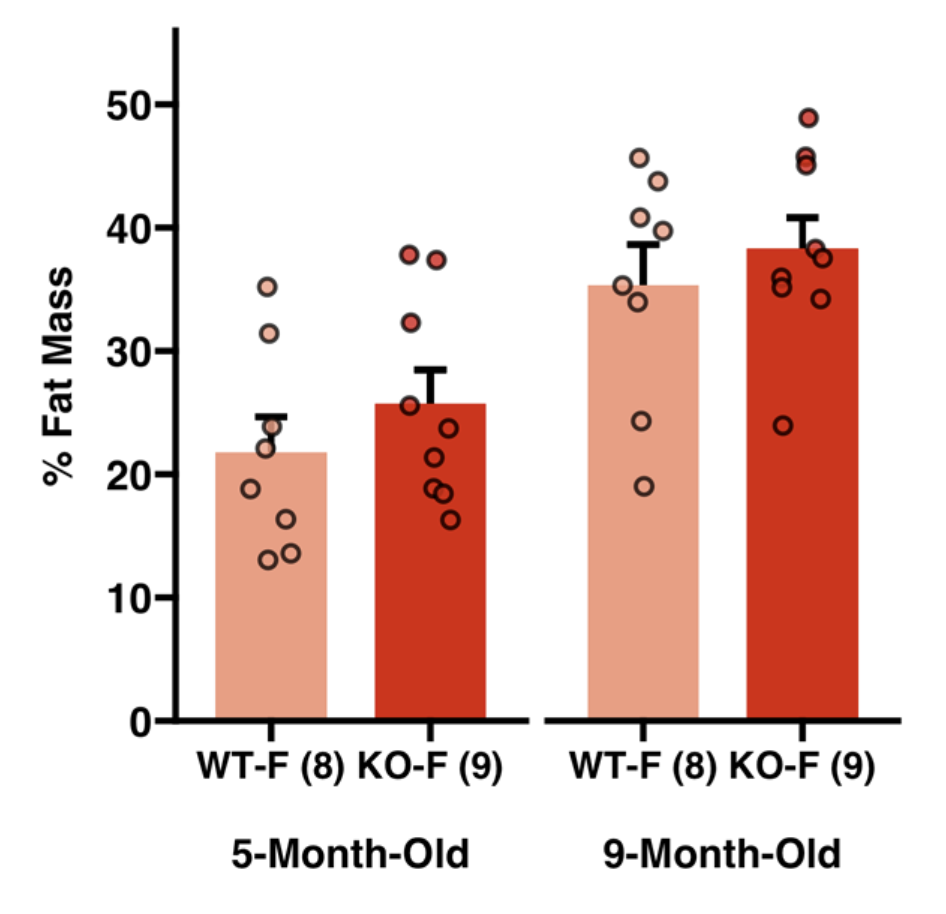
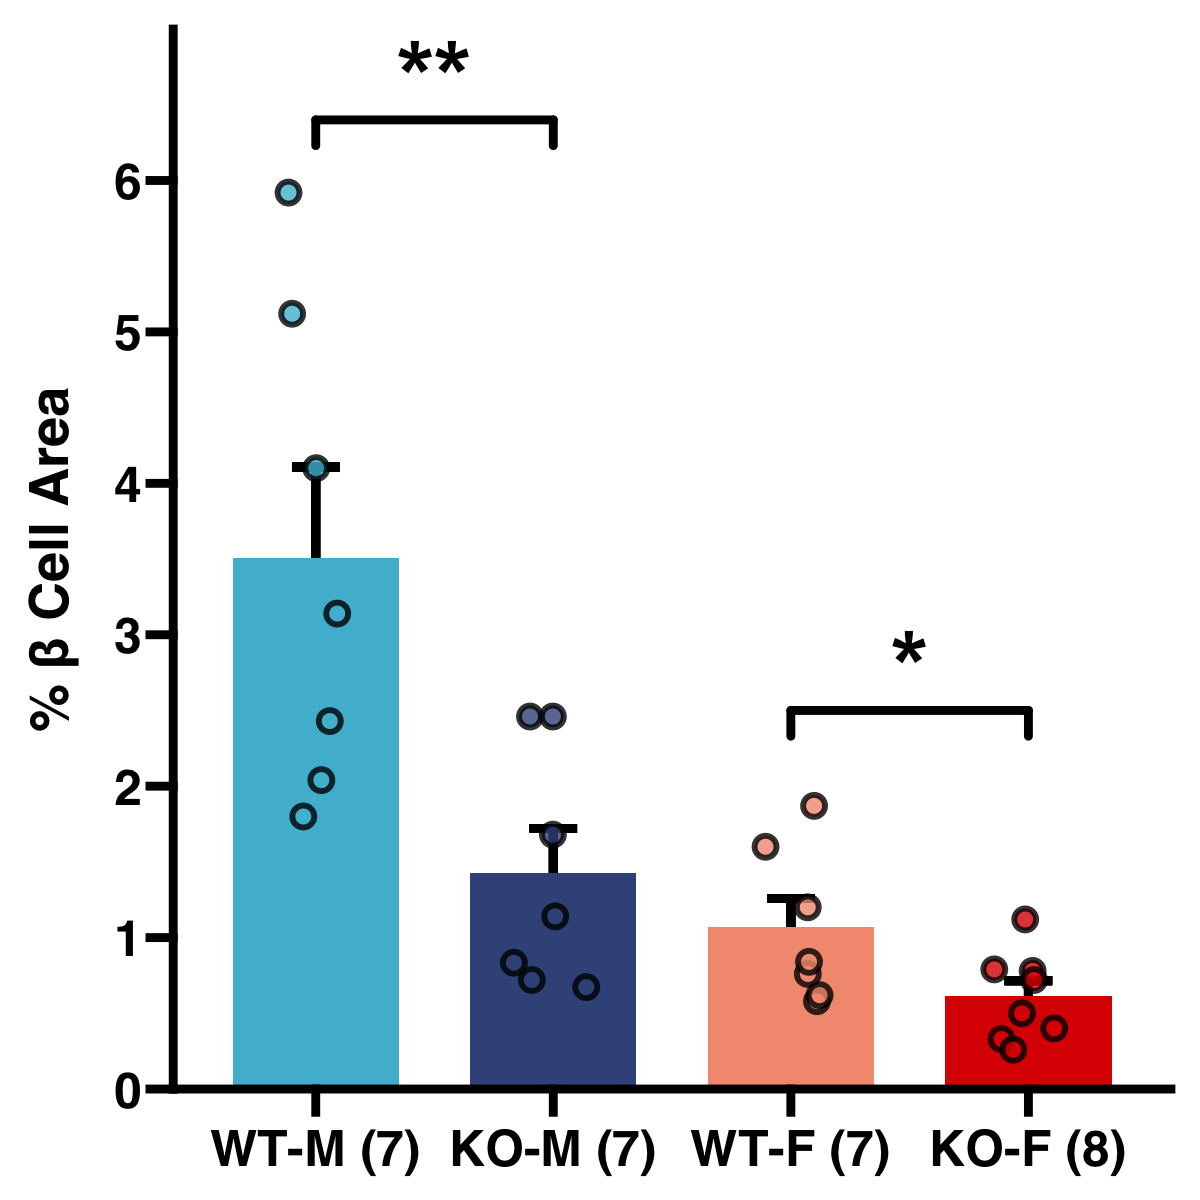
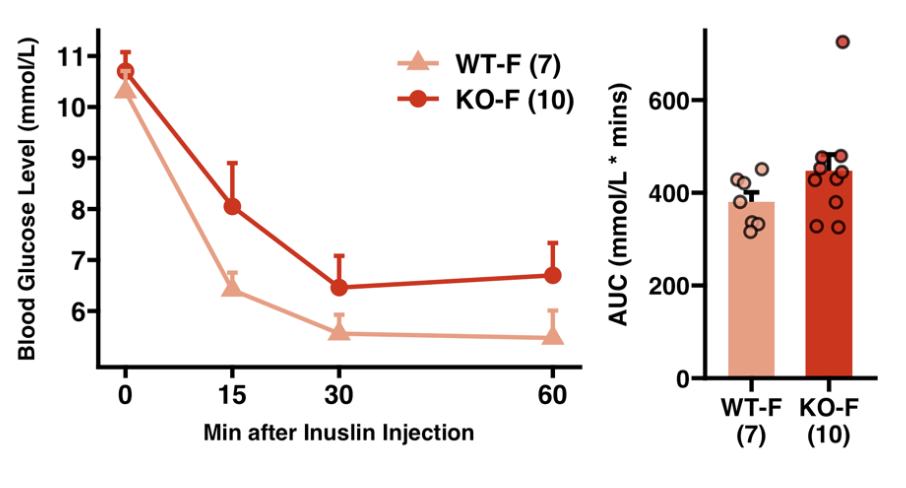
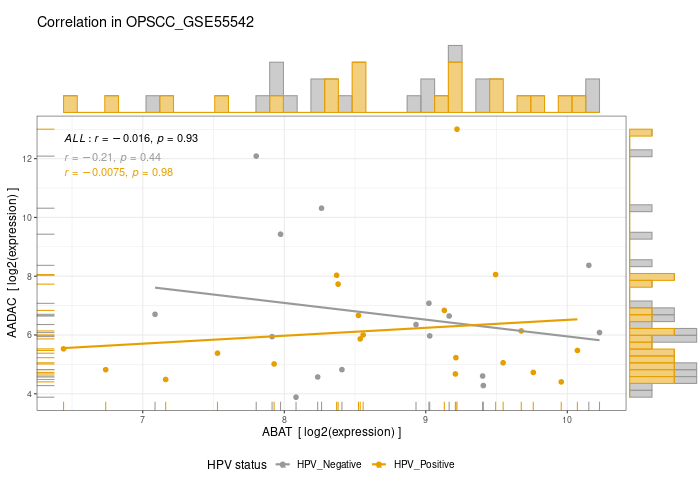
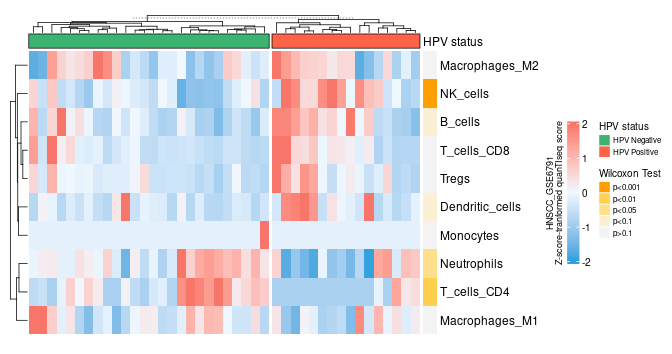
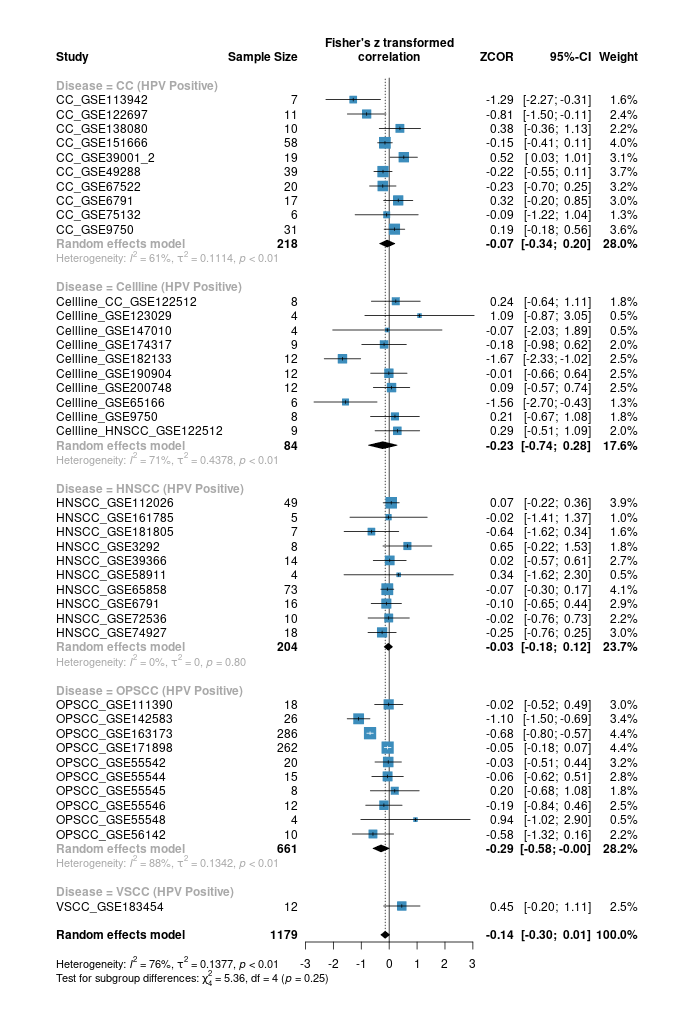
Here are a few of my visualization examples made entirely in R.
Communication: R isn’t just for math; it’s for sharing your work. You can build:
Interactive Web Apps: Using R Shiny.
Example: shinyDeepDR: Deep Learning Prediction of Cancer Drug Response.
Reproducible Documents: Writing your entire Master’s thesis or Research Day posters or eBooks using Quarto (like this website!).
4. R vs. Python: How to Choose?
This is the most common question for beginners. Both are excellent, but they serve different strengths.
| Feature | R | Python |
|---|---|---|
| Origins | Created by Statisticians | Created by Software Engineers |
| Best For | Data Analysis & Visualization | Machine Learning & Production |
| Bioinformatics | Deep roots in genomics/math | Strong in imaging and deep learning |
| Career Path | Academia, Medicine, Economics | Tech Industry, AI, Web Dev |
Our Advice:
If your primary goal is to analyze your own research data and publish papers, start with R.
If you eventually want to move into pure software engineering or heavy AI, you can study Python later.
The logic you learn in R will make Python much easier to learn!
5. How to use AI as a Learning Accelerator?
With the rise of powerful AI tools, many students ask: “If AI can write executable code for me, why should I spend time learning R myself?”
It is true that AI can be a brilliant assistant—even experienced bioinformaticians use it to explore new functions or speed up repetitive tasks. However, to be a scientist, you must move beyond “copy-pasting” to “comprehending.”
Why Foundational Knowledge Still Matters
1. Fluency in the Environment
You must understand the RStudio interface and foundational functions to work fluently. Relying 100% on AI is like using a GPS but not knowing how to drive the car; if the GPS loses signal, you are stranded.
2. The Critical Skill of Debugging
AI often provides code that is “almost” right but fails due to your specific data structure. You must learn to read error messages and understand the “why” behind a bug to fix it. Without this, you will spend more time arguing with the AI than actually analyzing your data.
3. The “Black Box” Risk (A Cautionary Tale)
Blindly trusting AI is dangerous. There are documented cases of users running AI-generated scripts that accidentally deleted entire directories because they didn’t read the line containing unlink() or rm(). As a researcher, you are responsible for the integrity of your data. If you don’t read the code, you are not in control of your research.
I recently heard a real case in which someone copy-pasted AI-generated code without fully reviewing it. A single incorrect command permanently deleted all of their files.
4. Expanding Your “Mental Toolbox”
By making an effort to understand each line of code, you build a mental library of what is possible. The next time you face a complex genomic problem, you won’t just ask AI for a solution—you will know which R tools (like dplyr or ggplot2) are the right ones for the job.
The “Pilot and Co-Pilot” Rule
Think of yourself as the Pilot and the AI as your Co-pilot.
The Pilot sets the destination, understands the flight plan, and double-checks the instruments.
The Co-pilot handles the manual, repetitive tasks to make the flight smoother.
Never give 100% of your trust to an external resource.
Whether it is code from an AI or a snippet from a forum, you must master the logic behind it. Master your code, and you master your research.
6. Recommended Learning Materials
If you want to dive deeper, here is a few free online books and materials:
Codecademy: Learn R Free Course: Good for those who prefer an interactive, “in-browser” coding experience to practice syntax.
McGill CDSI Workshops: Our colleagues at the Computational and Data Systems Institute offer excellent deep-dives into specific data topics.
McGill QLS-MiCM Workshops: Keep an eye on future MiCM workshops for specialized bioinformatics and high-performance computing training.
Appendix: R Visualization Gallery
Below are a few examples of my visualizations created entirely in R using ggplot2 and specialized bioinformatics packages.